If you’ve ever stared at a Forex chart and thought, “There has to be some kind of pattern here,” you’re absolutely right.
Markets don’t move randomly, they move in rhythms, cycles, and patterns driven by one thing: human psychology. Traders buy, sell, panic, get greedy, take profits, and repeat, forming visible structures on the chart over time.
That predictable rhythm is what the Elliott Wave Strategy helps you decode.
In this post, we’ll break down exactly what the Elliott Wave is, how it works, how you can apply it to your Forex trading, and why it remains one of the most powerful tools for market analysis especially when paired with Fibonacci levels and price action.
Let’s dive in.

What Is the Elliott Wave Strategy?
The Elliott Wave Theory was developed in the 1930s by Ralph Nelson Elliott, a brilliant accountant who discovered that markets don’t just move up or down randomly, they move in repeating waves.
He found that these price waves reflected the collective emotions of traders; optimism, greed, fear, and panic which cycle over and over again.
When mapped out, these emotions create predictable wave patterns.
So instead of seeing random price movement, the Elliott Wave approach helps you see structure and sequence in the chaos.
In Forex trading, this means being able to identify when a trend is starting, when it’s losing steam, and when a reversal might occur, all before most traders even notice.
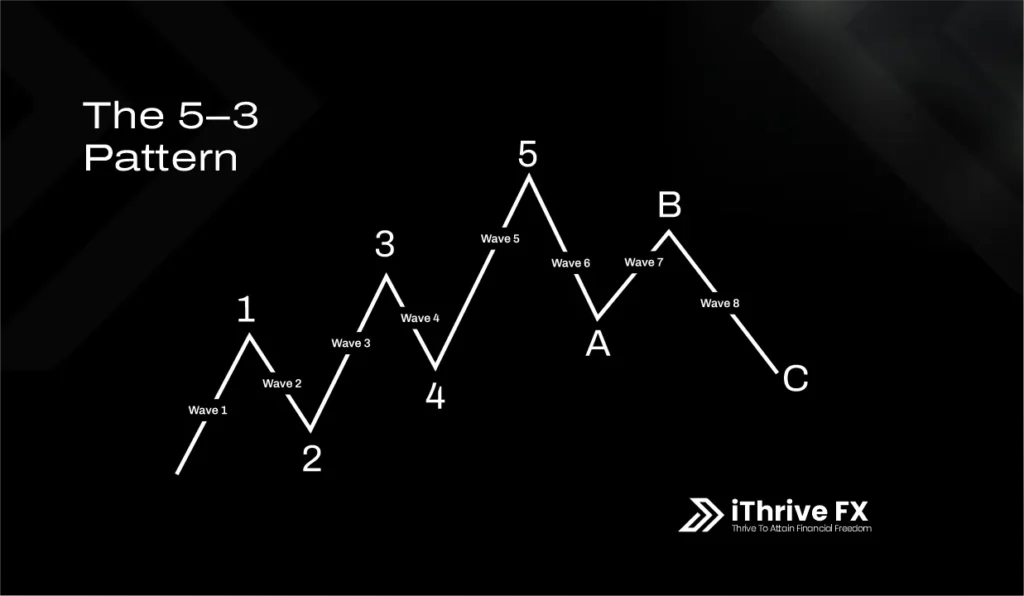
Understanding the Elliott Wave Structure: The 5–3 Pattern
At its core, Elliott Wave Theory is based on a simple structure:
- Five impulse waves (that move in the direction of the main trend)
- Three corrective waves (that move against it)
This makes up an 8-wave market cycle.
Let’s break that down step by step.
The Impulse Waves (1–5)
Impulse waves are the strong moves in the direction of the main trend. They represent market momentum buyers or sellers taking control.
Here’s how they unfold in an uptrend:
- Wave 1:The Initial Move Up
A small group of traders spots a buying opportunity early, causing price to rise slightly. The crowd doesn’t notice yet. - Wave 2: The First Pullback
Early buyers take profits, leading to a correction. But importantly, the price doesn’t fall below the start of Wave 1, a healthy retracement. - Wave 3: The Strong Push
The crowd finally joins in. Momentum increases, fundamentals may support the move, and this wave is usually the longest and most powerful of all five. - Wave 4: The Pause Before the Finale
The market cools down again as traders take profits. This wave tends to be choppy and sideways. - Wave 5: The Final Push
The trend reaches its climax. Everyone believes the price will keep going up but ironically, this is when the trend is weakest and ready to reverse.
The Corrective Waves (A–B–C)
Once the 5-wave impulse completes, the market takes a breather, forming a 3-wave correction.
- Wave A: The First Counter-Move
Traders begin selling to lock in profits, causing a moderate decline. - Wave B: The Fakeout Rebound
Buyers think the correction is over and push price up slightly — but it’s a trap. - Wave C: The Real Correction
Sellers dominate, pushing the market down for the final leg of the correction. Once it ends, a new impulse wave begins.
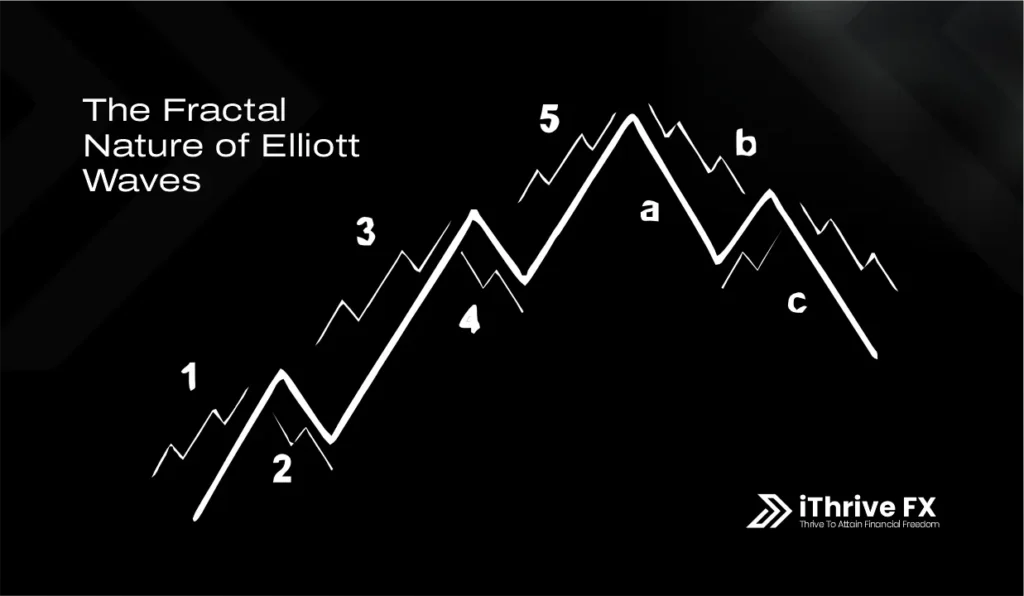
The Fractal Nature of Elliott Waves
Here’s where it gets fascinating, Elliott Waves are fractal.
That means each wave is made up of smaller waves inside it, and those smaller waves are made up of even smaller ones.
This self-repeating pattern shows up across all timeframes.
A five-wave structure on a 1-hour chart could be part of a single wave on the daily chart.
That’s why professional traders use the Elliott Wave Principle to analyze markets from multiple timeframes, spotting opportunities within both the big picture and smaller intraday swings.

How to Use the Elliott Wave Strategy in Forex Trading
Understanding the waves is one thing, trading them profitably is another.
Here’s a step-by-step approach you can apply right away:
Step 1️: Identify the Trend Direction
Zoom out and look for a clear five-wave impulse pattern. This helps you determine the dominant direction, bullish or bearish.
Step 2️: Wait for the Correction
After a five-wave impulse, expect an ABC correction. This is where most traders get trapped but Elliott traders prepare.
Step 3️: Plan Your Entry at the End of Wave C
Wave C often marks the end of a pullback and the start of a new trend.
Enter your trade around that zone using price action confirmation (like bullish engulfing candles or breakouts).
Step 4️: Use Fibonacci Levels to Confirm Your Setup
Elliott Waves and Fibonacci ratios are a match made in trading heaven.
- Wave 2 typically retraces 50–61.8% of Wave 1.
- Wave 3 often extends to 161.8% of Wave 1.
- Wave 5 often equals the length of Wave 1.
By combining both, you can pinpoint entries, targets, and stop-loss levels more accurately.
Step 5️: Manage Risk Like a Pro
Always place your stop-loss just below (in an uptrend) or above (in a downtrend) Wave 1.
This keeps your losses small if your wave count turns out to be wrong — which can happen even to seasoned traders.
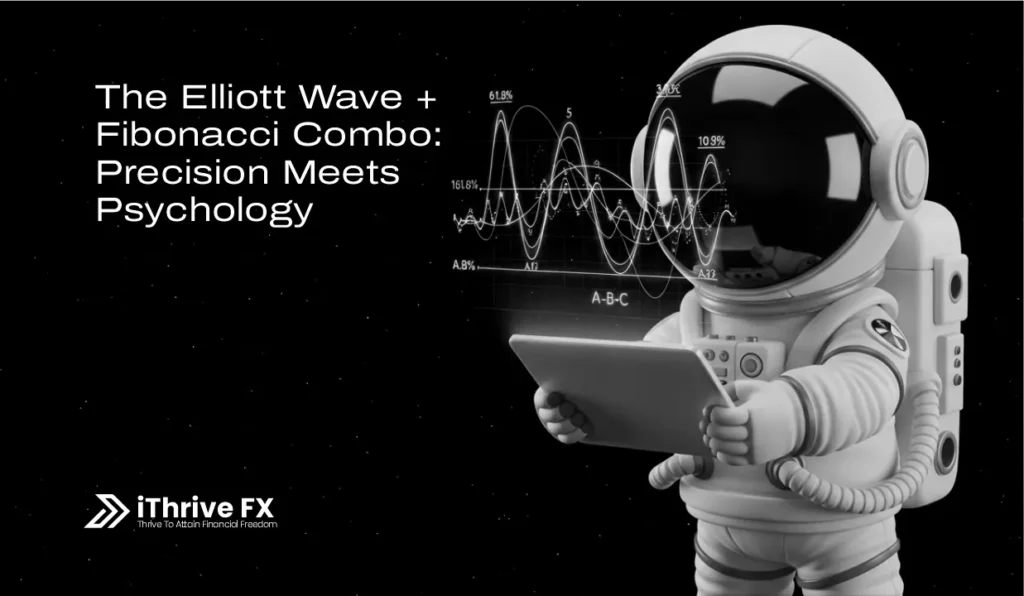
The Elliott Wave + Fibonacci Combo: Precision Meets Psychology
Elliott found that market waves naturally align with Fibonacci ratios — the golden sequence found everywhere in nature.
In Forex, these ratios appear in retracements and extensions, showing where price is likely to stall or reverse.
Here’s how traders at iThriveFX use them together:
- Combine Elliott Waves to identify structure.
- Use Fibonacci tools to validate the size and reach of each wave.
- Confirm with momentum indicators like RSI and MACD.
This three-step approach gives traders both context (structure) and confidence (confirmation).

Why Elliott Wave Theory Works: It’s All About Psychology
At its heart, the Elliott Wave Strategy isn’t about numbers, it’s about people.
Markets rise when traders are optimistic and fall when fear sets in. These emotional reactions create patterns of optimism and pessimism that appear repeatedly in price charts.
That’s why Elliott Waves remain so timeless, they’re built on the psychology of crowds, not algorithms.
And as long as humans trade, crowd psychology will continue to shape price movement.

The Challenge: It’s Powerful but Subjective
The Elliott Wave Theory isn’t easy to master.
Two traders can look at the same chart and label the waves differently.
That’s why wave analysis should never stand alone.
Use it alongside:
- Price action
- Volume analysis
- Key support and resistance zones
- Technical indicators (RSI, MACD, EMAs)
This combination gives you a well-rounded view of the market.
Why Smart Traders Choose the Elliott Wave Strategy
Here’s why the best Forex traders still rely on this theory:
- It helps you spot trend reversals before they happen.
- It gives structure to what seems like random price action.
- It improves your timing for entries and exits.
- It deepens your understanding of market psychology.
At iThriveFX, we’re passionate about helping traders see beyond the candles, to understand the story behind every move.
Final Thoughts: Ride the Wave, Don’t Chase It
Trading is not about predicting every move, it’s about understanding rhythm.
The Elliott Wave Strategy helps you do just that: it lets you see the market’s breathing pattern.
So, the next time you open your charts, don’t just look for setups.
Look for waves.
Feel the rhythm.
Ride it with discipline and confidence.
Because at iThriveFX, we don’t just trade, we thrive on insight.

