


If you’ve ever sat in front of your charts and wondered, “Wait… is this the end of the trend or just a quick dip?” you’re not alone.
Every trader, from beginner to pro, has faced that “should I hold or exit?” dilemma.
And truthfully, knowing the difference between a market reversal and a pullback can be the difference between growing your account… and watching your profits evaporate.
Let’s break this down the iThriveFX way; simple, practical, and real.
First,
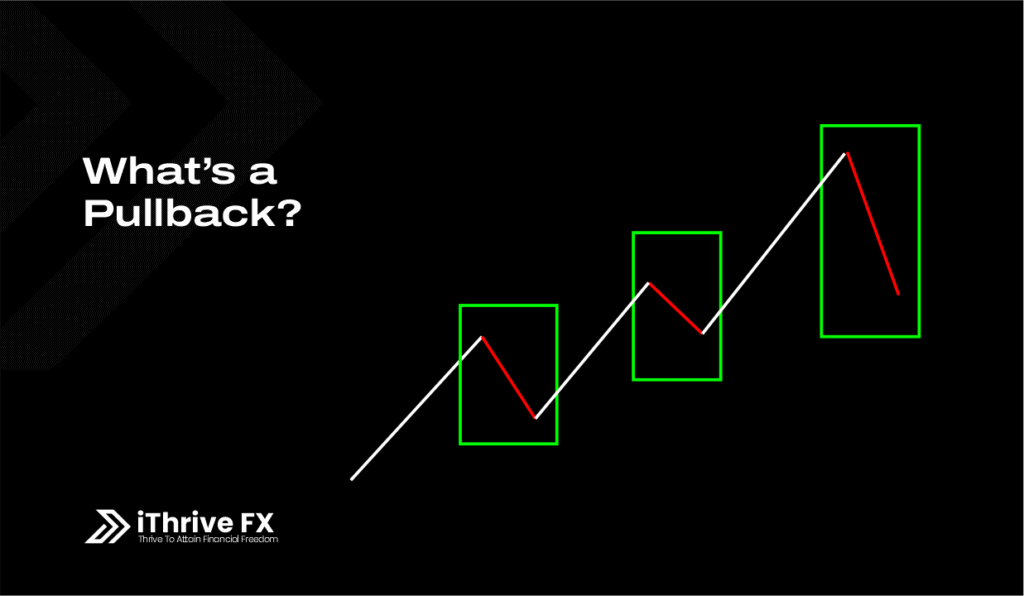
What’s a Pullback?
A pullback is like your market taking a breather, a short-term pause before continuing in the same direction.
Think of it like this:
You’re running uphill (that’s your uptrend) and you stop to catch your breath for a few seconds, that’s your pullback. You’re not changing direction; you’re just regaining strength.
In trading terms, a pullback is a temporary dip within a larger uptrend or a brief bounce within a downtrend.
It’s healthy. It’s normal. It’s part of the rhythm of price action.
Now,
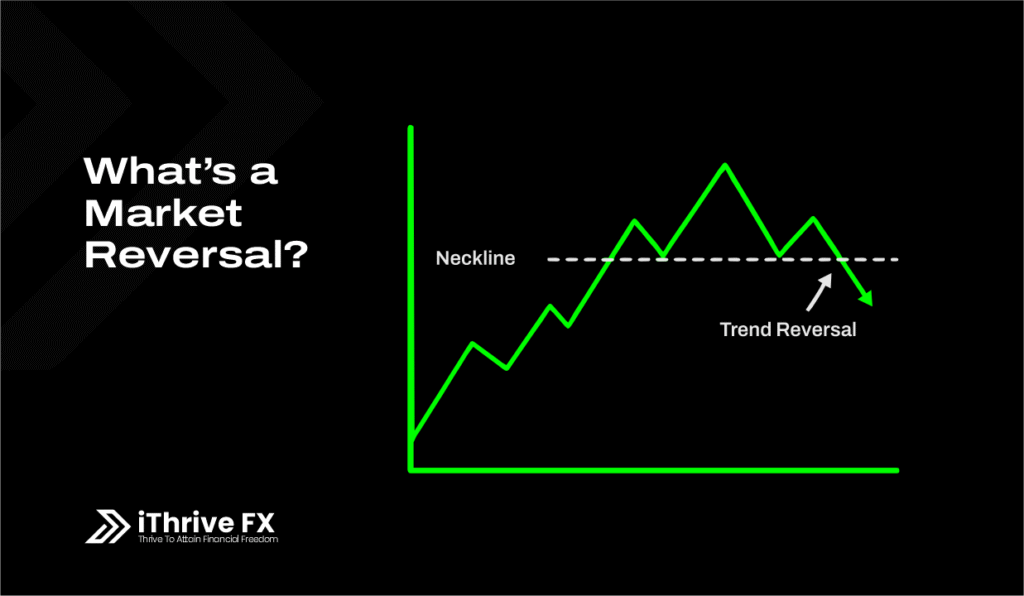
Market Reversal?
A market reversal is when the entire direction of the trend changes.
So you were running uphill, but now you’ve reached the top and you’re heading down. That’s a reversal.
In trading, it’s when buyers lose control and sellers take over (or vice versa). The market doesn’t just pause, it turns around completely.
How to Tell the Difference (Without Guessing)
Here’s the real question every trader asks: “How do I know if it’s a reversal or just a pullback?”
Let’s look at a few practical checkpoints:
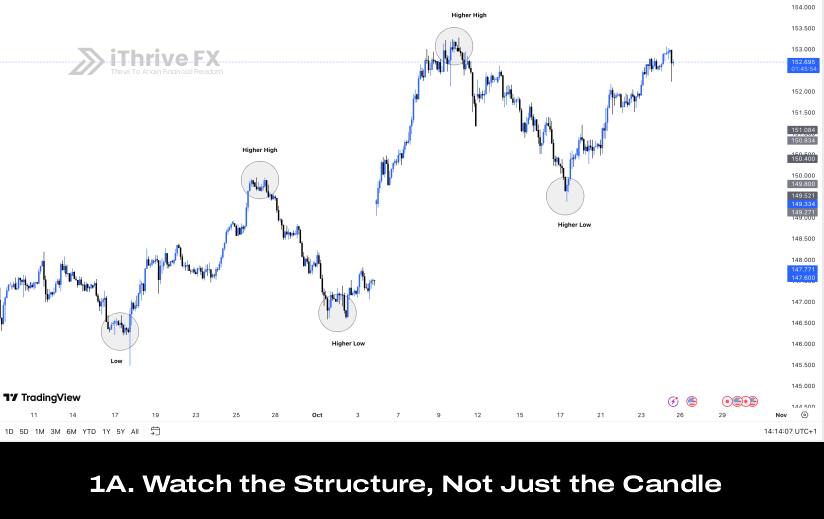
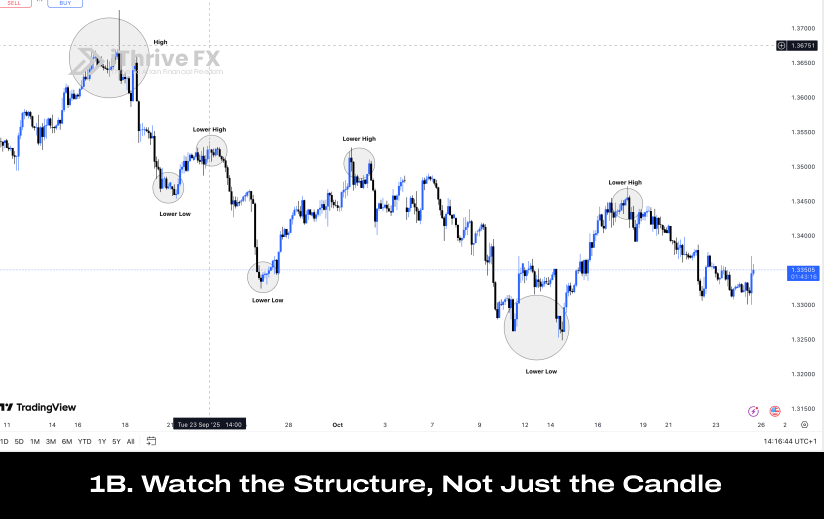
1. Watch the Structure, Not Just the Candle
In a pullback, structure remains intact: higher highs and higher lows in an uptrend.
In a reversal, structure breaks: a lower low forms in an uptrend (or higher high in a downtrend).
Pro tip: Always zoom out. Don’t let one candle trick you into thinking the market has turned.
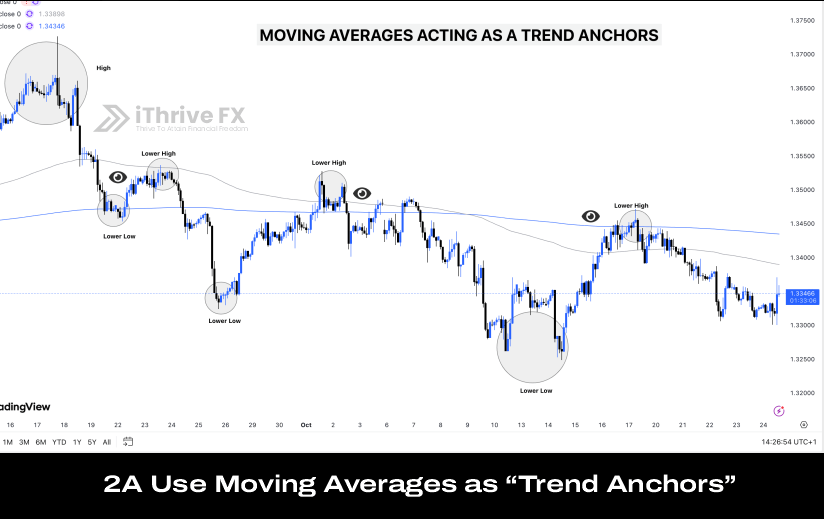
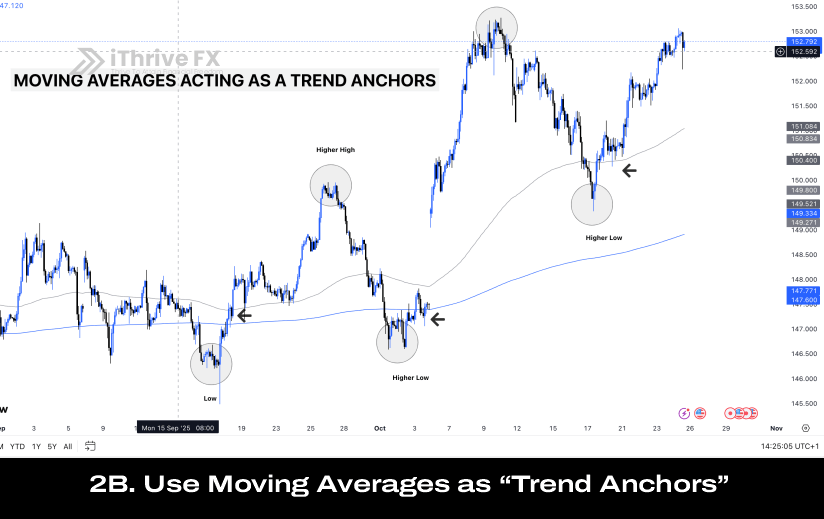
2. Use Moving Averages as “Trend Anchors”
A pullback often bounces near short-term moving averages (20 EMA, 50 EMA).
A reversal breaks through these moving averages and retests them from the other side.
If the 50 EMA that used to act as support now becomes resistance, you’re likely looking at a reversal.
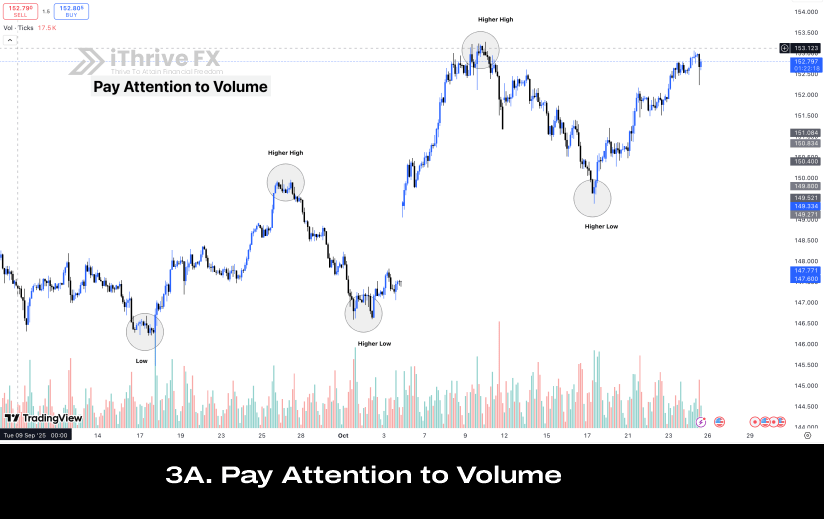
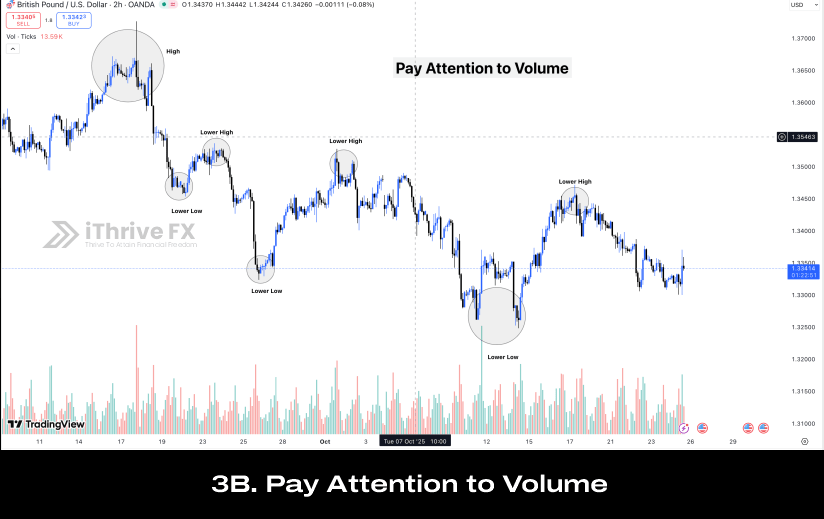
3. Pay Attention to Volume
During a pullback, volume usually decreases, fewer traders are participating in that minor correction.
In a reversal, volume increases significantly as new players flood in, shifting market sentiment.
Volume doesn’t lie.
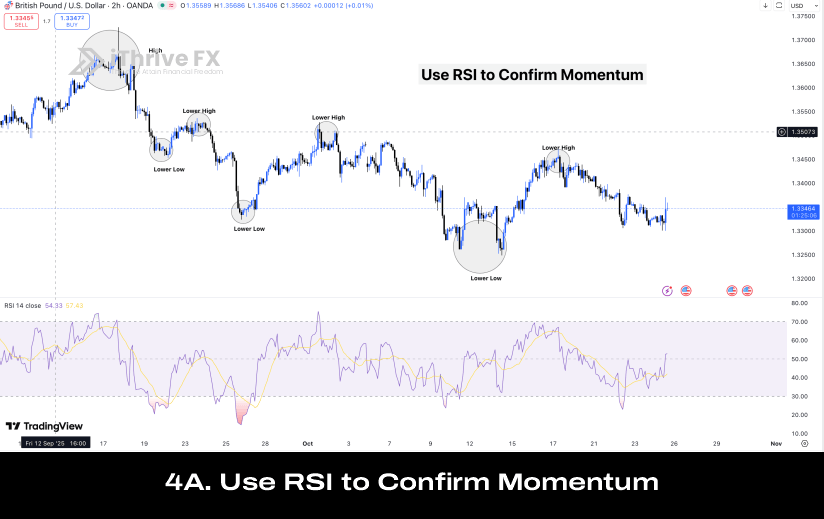
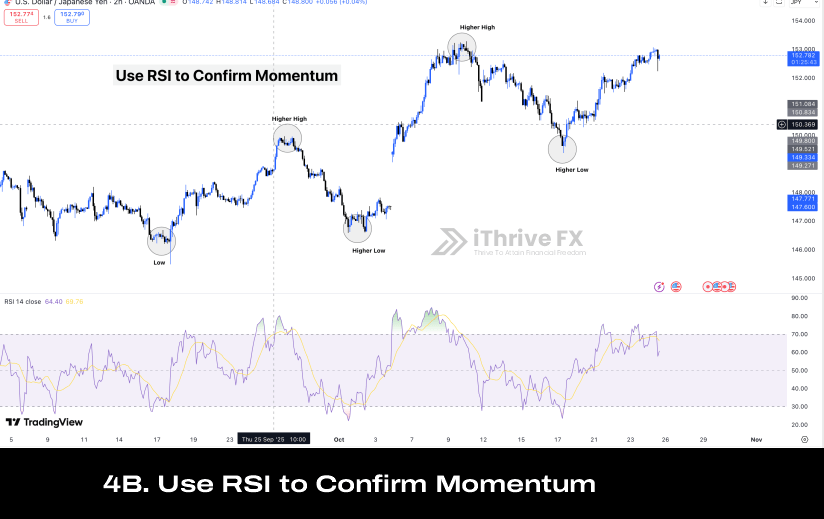
4. Use RSI to Confirm Momentum
If RSI pulls back slightly but stays above 50 (in an uptrend), it’s likely a pullback.
If RSI crosses below 50 and stays there, the strength of the trend might be fading.
The Mindset Part (Because Trading Isn’t Just Technical)
Here’s something most traders don’t talk about emotional bias.
When you’re in profit, you want every pullback to be “just temporary.”
When you’re at a loss, you hope every move against you is “just a retracement.”
But hope is not a strategy.
Clarity comes from confirmation, not emotion.
Always let your analysis, not your attachment, decide your next move.
Quick Recap; Spot the Difference
| Feature | Pullback | Reversal |
| Direction | Short-term pause | Full trend change |
| Market Structure | Intact | Broken |
| Volume | Low | High |
| EMAs | Bounce from | Break through |
| RSI | Stays near trend zone | Crosses neutral line |
| Trader’s Move | Look for entries | Look for exits |
Trade Smart, Not Emotional
Every market has its rhythm; up, pause, up again… then sometimes, down.
Your job as a trader isn’t to predict every move; it’s to interpret the signals and react with discipline.
When you can confidently tell a pullback from a reversal, you stop reacting and start trading with strategy.
So next time you’re on your chart, ask yourself:
“Is this market catching its breath… or changing its mind?”
That question alone can save your account and grow your confidence.
Join the iThriveFX Telegram community to stay up to date with the forex market and ensure to equip yourself with top trading knowledge by registering to iThriveFX Private Mentorship Program